Does the Permanent Portfolio really protect you from market volatility? We use the CRM2Plus software to test if it truly performs well under any economic conditions.
The Permanent Portfolio is a portfolio that is designed to perform well under all economic conditions. It originated in the 1980s by an investment advisor Harry Browne. He constructed a portfolio that he believed to be safe and profitable in any economic state. The portfolio consisted of the following assets:
25% US Stocks
25% Long-term Government Bonds
25% Cash (short-term t-bills)
25% Gold
Investment allocation in the Permanent Portfolio is equally weighted across the above four asset classes and the proportion is held constant throughout the holding period. This strategy aims to hedge the portfolio by balancing the decline in one asset class in a particular market environment by another asset class that typically rises in value under the same economic conditions.
For example, while the stock market tanks during a recession due to slower growth, there is a flight to quality and increased demand for safer assets such as government bonds and gold since they will likely outperform stocks in an economic downturn. The Permanent Portfolio provides a safety cushion against any fall of an asset and thus lowers the risk involved.
It is recommended to rebalance the portfolio annually to maintain equal allocation weighting across the asset classes. The Permanent Portfolio is an ideal portfolio for investors who are looking for a low-risk portfolio that will perform well in all economic conditions.
Using the CRM2Plus software, we can test to see if The Permanent Portfolio truly performs well under any circumstances. We can create five portfolio plans comparing the Permanent portfolio against single-class allocation in stocks, bonds, gold and GICs:
 CRM2Plus: Snapshot of Benchmarked Portfolios
Portfolio 1: 100% S&P 500 Index (US Stocks)
Portfolio 2: 100% Vanguard Long-Term Bond Index Fund (Government Bonds)
Portfolio 3: 100% Gold
Portfolio 4: 100% GIC (Cash)
Portfolio 5: The above four asset classes equally weighted 25% (Permanent Portfolio)
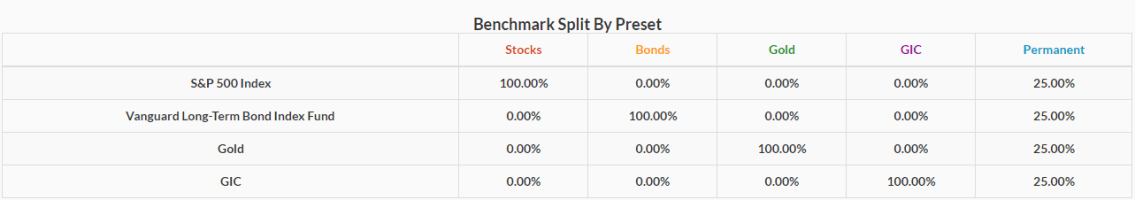
In particular, we see the breakdown of the Permanent Portfolio as shown below:

CRM2Plus: Permanent Portfolio Allocation Breakdown by Asset Class
We use the software to perform an analysis of what $100,000 would be worth now if we invested in these portfolios 15 years ago, in 2003. We can generate a graphical representation of the fair market value (FMV) to concurrently see how all five portfolios have performed historically across business cycles:
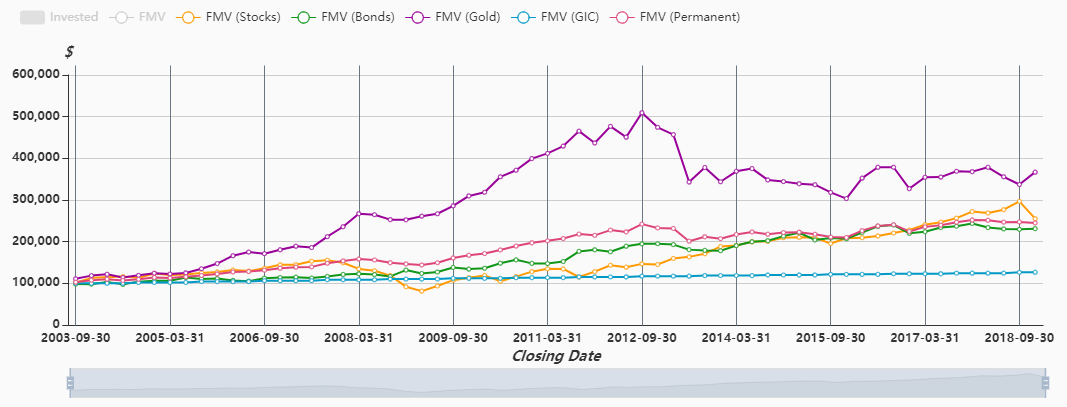 CRM2Plus: Benchmarked Portfolios Historical Performance by FMV
Scrolling over to the different time points in time, we can see at the end of 2018 how much the $100,000 invested in 2003 would be worth today depending on the portfolio. This is shown by the Fair Market Value (FMV) of each portfolio. The value of the Permanent Portfolio sits at around $245k, which is in the middle of the pack in terms of portfolio value.
 CRM2Plus: Benchmarked Portfolios FMV as of Dec 31, 2018
It is also easy to generate a summary of the account through CRM2Plus which can be used by advisors to show clients a breakdown of key investment return statistics as well as contributions, withdrawals, and transfers. Below is a snapshot of the account summary generated through the software:
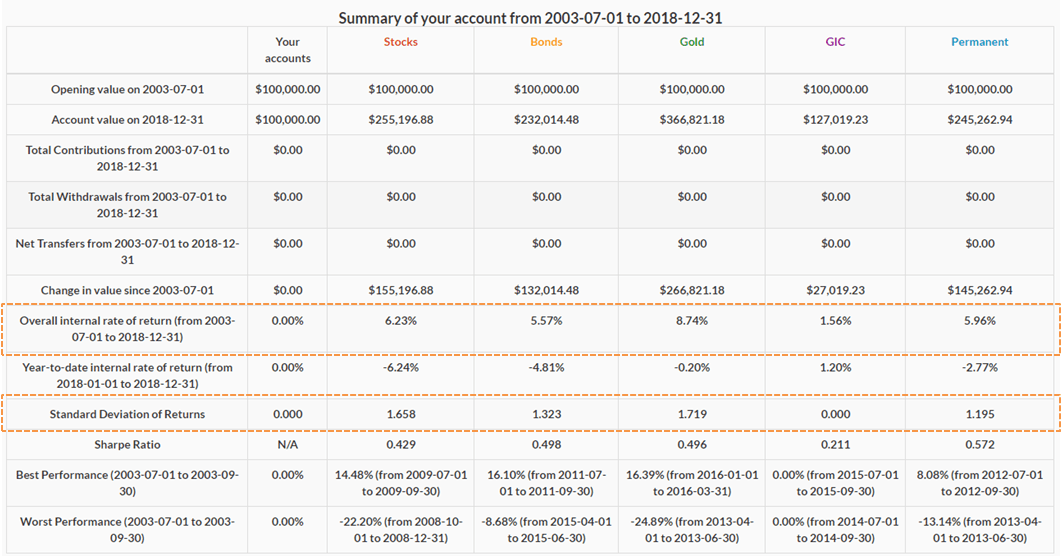 CRM2Plus: Benchmarked Portfolios Account Summary
We notice that although the portfolios allocated purely to Gold (8.74% IRR) and Stocks (6.23% IRR) performed better than the Permanent Portfolio (5.95% IRR); the performance of the gold and stocks asset classes were correlated with the higher degree of volatility which makes sense according to risk-reward tradeoff.
The Permanent Portfolio is meant to be a safe and profitable portfolio and its performance was in-line with the strategy by yielding an overall IRR of 5.95%, which is comparable to the pure stocks portfolio but at a much lower level of volatility (0.00146 for Permanent vs. 0.00296 for Stocks; as shown below).
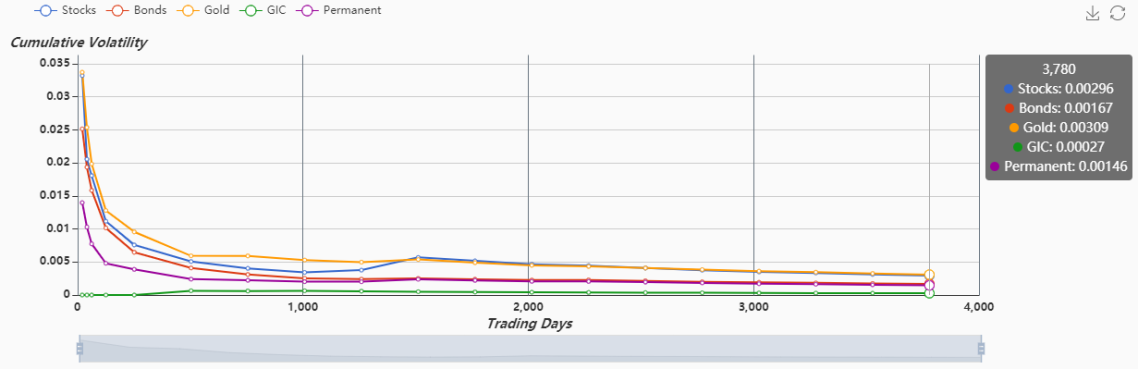 CRM2Plus: Volatility Graph at 3780 trading days
CRM2Plus’ interface allows users to filter out different portfolios, offering increased visibility in focused view. Comparing the Fair Market Value of the Permanent Portfolio alongside the 100% Stocks Portfolio in the chart below, we see that there was a period in the recession between 2008 and 2009 where the stocks portfolio dipped below the $100k principal that was invested in 2003.
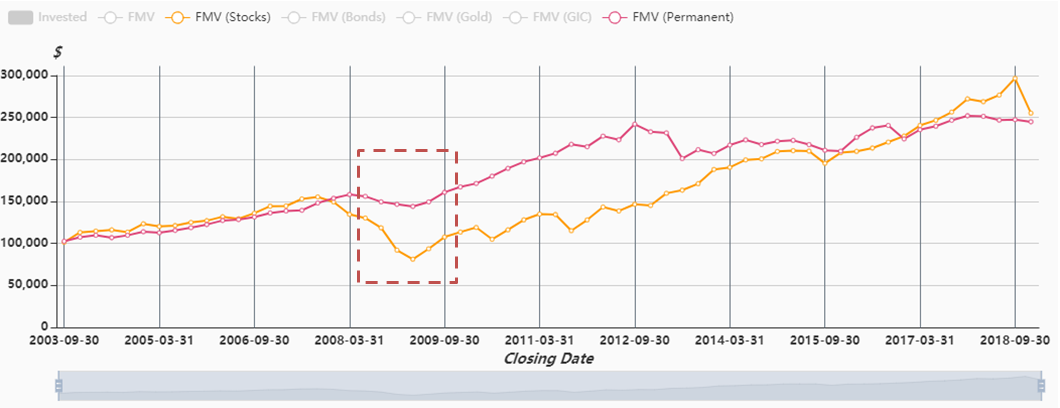 CRM2Plus: Historical Performance of Stock Portfolio vs. Permanent Portfolio
The Permanent Portfolio was resilient during the recession and compensated for the decline in the stock market mainly attributable to the stronger performance of gold, as well as the slow and steady rise in government bonds. Furthermore, we see that this outperformance continued in the following years as the economy gradually recovered with stocks entering into the longest rally in history from mid-2009 to mid-2018.
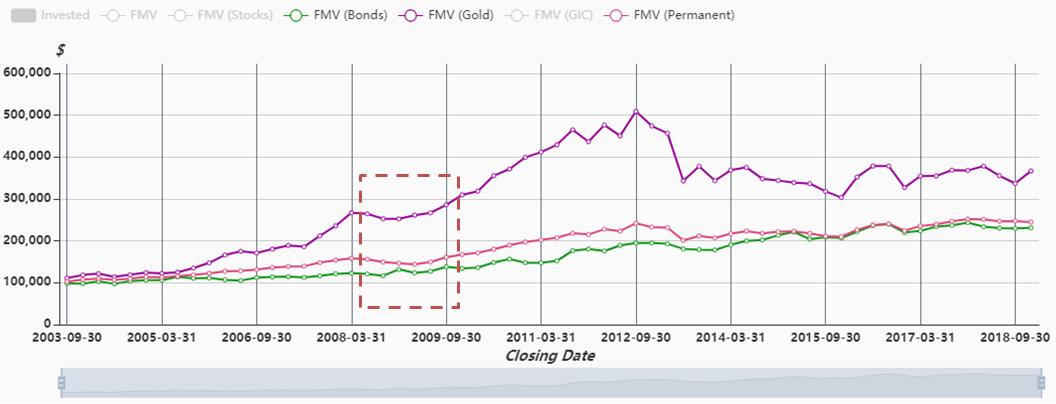 CRM2Plus: Historical Performance of Bonds Portfolio, Gold Portfolio, and Permanent Portfolio
CRM2Plus provides an effective solution to monitor your portfolio and makes comparing portfolios an effortless task. We can see from the graphs that the Permanent Portfolio indeed generates a stable return while keeping volatility low. The Permanent Portfolio stayed on a relatively stable increase under all economic conditions despite recessionary pressures and volatility that impacted other asset classes. Using the CRM2Plus software, we can visually see the Permanent Portfolio being capable of handling all economic conditions within the observed time frame between 2003 and 2018. It is also recommended to rebalance the Permanent Portfolio annually to maintain the equal weightings of the assets.
