An assortment of benchmarks can be used to compare how a portfolio is performing relative to various market segments. Financial benchmarks are an important pillar in portfolio management and used in almost all investment strategies. Active fund managers try to beat the benchmarks they’ve set, passive funds use benchmarks to replicate their portfolio returns and risk profile based on a broader market-wide performance metric. Most funds will generally have established benchmarks for standard analysis.

What is a benchmark?
A benchmark such as the S&P 500 (for public equities) consists of a basket of market securities and is used as a standard measure to analyze the relative performance of a given portfolio. Using the S&P 500 as an example, the popular index is a basket of the 500 largest U.S. stocks and is widely considered to be the most representative picture of how large U.S. stocks are performing on a day-to-day basis.
For retail investors, a benchmark can be used as a reference point for comparing how your personal or managed portfolios are performing compared to the overall market or a well-known index that is managed by an institution.
What is benchmark investing?
Benchmark investing is a strategy that is used to deliver results relative to the overall returns of a benchmark such as the S&P 500. Active managers try to outperform the benchmarks they are compared to, rather than being based on an absolute amount of return of a certain period. For example, if a portfolio is based on absolute returns of 8% over the course of a year, any returns above 8% would be considered good since it is beating the target. However, for a portfolio benchmarked against the S&P 500, a “good” return or outperformance would be relative to how much the S&P 500 returned over the same period.
For illustration, the S&P 500 returned +18.7% in 2017, and for 2018, it is on-track for negative returns (-7.7% as of Dec. 20, 2018). A portfolio benchmarked to the S&P 500 delivering 8% in 2017 would have underperformed, while in 2018, an 8% is considered an outperformance. Active managers try to outperform the benchmarks they compare to and get a higher return than it.
Benchmark Investing with CRM2Plus
Benchmarking can be very useful in analyzing current and potential investments. If you have the right benchmarks to compare to, it can help you evaluate your performance compared to an investment benchmark. It is an effective way to ensure that an investor’s portfolio is optimally diversified and aligned with their goals. Following this approach means that instead of trying to maximize returns, you are trying to reduce risk.
CRM2Plus provides an effective solution to monitor your portfolio and makes benchmarking an effortless task. Rather than using generic benchmarks, you can customize your own benchmarks that are more closely reflective of your portfolio.
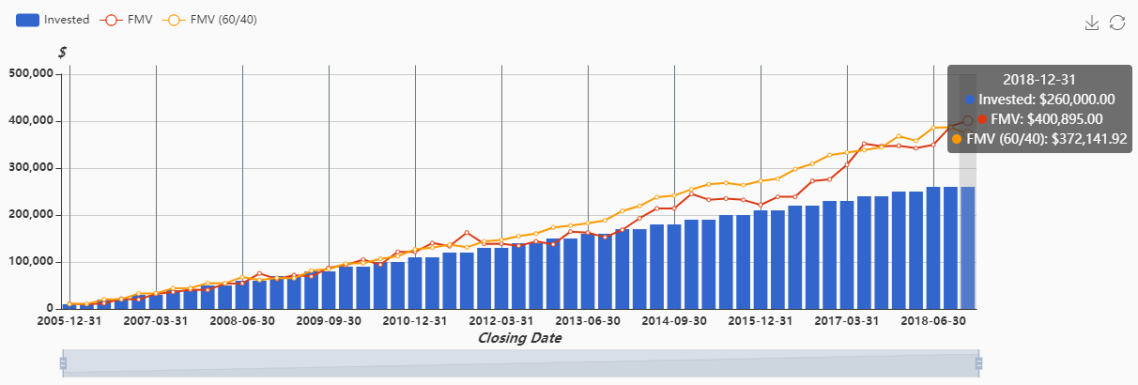
Imagine that you have a portfolio that includes $10,000 contributions made semi-annually over the course of 13 years and has a current market value of $400,895. You might be curious to see what those contributions could have produced for you if you had followed a more traditional 60/40 stock/bond split.

By creating a “60/40” benchmark in CRM2Plus (as shown in the chart above) with a 60% allocation in the S&P/TSX 60 index stocks and 40% allocation in bonds including 20% in GIC and 10% each into the two Vanguard bond index funds, you’ll be able to see how your portfolio performed with a counterfactual analysis.
CRM2Plus creates a simulated portfolio with those same contributions split between the assets you’ve included in your benchmark ($6000 invested in the S&P TSX and $4000 invested in bonds, invested on the same dates you’ve made your contributions). The closing values of your simulated portfolio are calculated each quarter. By selecting this benchmark, the simulated portfolio will be graphed alongside the performance of your actual portfolio for any report type.
Aggregated Funds Invested vs. Fair Market Value
Generated on 2018-12-18 for Jane Doe

The chart above is a snapshot from CRM2Plus showing how the fair market value of your portfolio would have performed alongside your custom 60/40 benchmark. You can easily slide the pointer to see your performance at any point in time, showing a clear breakdown of portfolio performance over your investment period.
For financial advisors, the use case is even more compelling as it makes discussions with clients much easier and intuitive. Rather than gathering the data points manually and running the calculations through Excel, everything you need is always kept up-to-date and ready to go.
For more information on how to set up customized benchmarks on CRM2Plus, check out our how-to video on benchmarking.
